EUR/USD and EUR/GBP Analysis: A Sharp Drop

Overall Analysis
- EUR/USD fell sharply on the 1st Nov Trading session after a strong spike up. Still, previous higher low swings are intact.
- EUR/GBP showed the same fall on 1st Nov, keeping the previous lows intact and slowly moving upside.
EUR/USD Chart Analysis
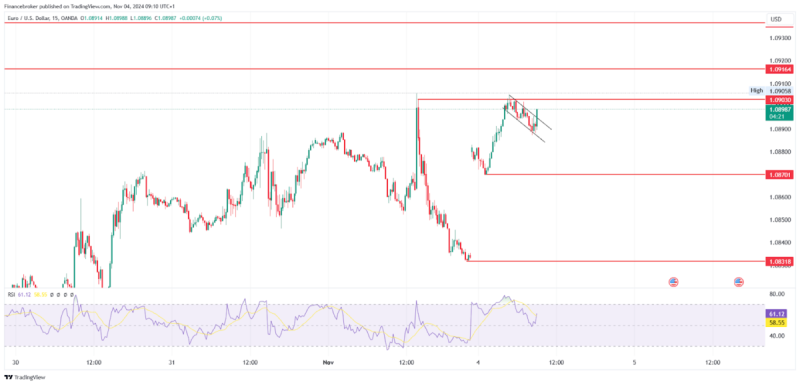
EUR/USD 15-Minute Chart (Source: TradingView)
On the 1st Nov 2024 trading session, prices fell, closing around -50%. Price recovered sharply on 4th Nov trading session with a huge gap-up. Currently, the price did not break any previous higher low area, indicating strength towards the upside.
On a daily time frame, the price can be seen reversing from the major support level after delivering its double-top pattern target. Price should retest 0.5 fib retracement level, keeping the bull rally intact.
Currently, looking at a 15-minute time frame, the EUR/USD price faces rejection from the 1.09030 level and continues hovering around it, making a flag and pole pattern. There are a few levels traders can plan to make their entry.
- If the price breaks the 1.09030 level and sustains above it with an RSI below 60, then one can go for a buy position with a stop loss below the previous low and targets of 1.09164 and 1.09367. Make sure to trail stop loss as the price can face sharp rejection from the levels.
- If the price creates a new day high and is rejected, wait for the price to break the 1.08872 level. This level will trigger a Double Top pattern with stop loss above the previous swing high and target of the day low.
EUR/GBP Chart Analysis
EUR/GBP 15-Minute Chart (Source: TradingView)
On the 1st Nov 2024 trading session, EUR/GBP can be seen falling sharply towards 0.83692 level. Price has still kept previous Higher Lows intact but is currently moving sideways under a strong rejection zone.
On a daily time frame, the price has fallen sharply and is now facing rejection from previous swings. Currently, on a higher time frame, selling is still in strength.
If looking at the 15 min time frame, then we can see the price is currently in a strong zone. 1st November fall has not been recovered yet. There are multiple entries that traders can plan, below is the list.
- If the price breaks the 0.84180 level and sustains above it, more buying will trigger in this situation. With stop loss below the previous swing low and a target of 0.84480
- Suppose the price breaks 0.83533, which was the previous swing low, a sharp fall is expected. In that case, you can enter if the price sustains below it, setting a stop loss above the previous swing high and aiming for a target of 0.83198.
The post EUR/USD and EUR/GBP Analysis: A Sharp Drop appeared first on FinanceBrokerage.


